The U.S. Bureau of Economic Analysis just released 2012 Gross Domestic Product (GDP) estimates for Metropolitan Statistical Areas (MSAs) in the United States. On average, MSA real GDP (adjusted for inflation) increased by 2.5 percent in 2012—slightly lower than the total U.S. average of 2.8 percent.
Nationally, Texas and Indiana dominated the rankings for the fastest-growing MSAs. Each of these states placed three MSAs among the top ten. The New Orleans and San Francisco MSAs showed the fastest-growing large MSA economies.
Showing posts with label Region--Wasatch Front South. Show all posts
Showing posts with label Region--Wasatch Front South. Show all posts
Wednesday, September 18, 2013
Monday, February 25, 2013
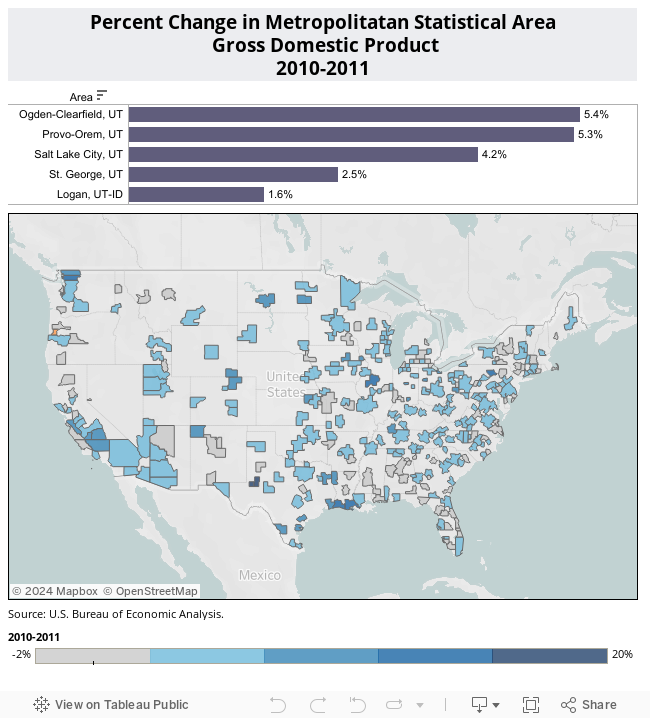
2011 Advance GDP by Metropolitan Area Released
The U.S. Bureau of Economic Analysis recently released gross domestic product estimates for the nation’s 366 metropolitan areas. In 2011, metropolitan area growth registered an average of 1.6 percent—just slightly higher than the U.S. total (1.5 percent). However, the growth rate for metro areas dropped noticeably from the 2010 expansion of 3.1 percent.
Only 242 of the nation’s metropolitan areas experienced a 2011 gain in GDP. However, all of Utah’s metro area’s showed increases equal to or greater than the U.S. metro average. Both Ogden/Clearfield and Provo/Orem generated gains of greater than 5 percent. Lowest on the scale proved the Logan metro area with a gain of only 1.6 percent. For more information on the current release, click here.
Only 242 of the nation’s metropolitan areas experienced a 2011 gain in GDP. However, all of Utah’s metro area’s showed increases equal to or greater than the U.S. metro average. Both Ogden/Clearfield and Provo/Orem generated gains of greater than 5 percent. Lowest on the scale proved the Logan metro area with a gain of only 1.6 percent. For more information on the current release, click here.
Wednesday, February 20, 2013
Utah Senate committee debates prison relocation

Sen. Scott Jenkins introduced legislation that creates an authority to manage the relocation of the Utah State Prison and evaluate proposals from companies seeking to build a new prison or develop the old site.
The Utah State Prison occupies about 700 acres in Draper where tech companies such as eBay and Microsoft have opened offices.
Gov. Gary Herbert has called on lawmakers to fund the relocation so the corridor can develop as a technology hub. State officials have been weighing relocation for several years.
The Utah State Prison was built in 1951 and houses about 4,500 inmates. Before that, Utah's state prison was at what is now Sugar House Park.
The state also operates a prison in Gunnison, the Central Utah Correctional Facility.
The goal is to get the legislation passed quickly so the authority can get up and running by April 15, as required by the bill, Sen. Scott Jenkins said.
The authority would then seek proposals from companies and come back to the Legislature and governor with a viable option.
It's unlikely any proposal would be ready to come before the Legislature by the time next year's session concludes, but the governor could convene lawmakers in a special session to approve the plan.
Some of the possible sites that have been considered for the new prison are in northwest Utah _ specifically Box Elder County, Juab County and Tooele County. Cache Valley Daily
Monday, March 12, 2012
Foreclosure Rates
I've had a couple of questions lately about where to find foreclosure rates by county. Without paying for information, county-level foreclosure rates are hard to find and when you can find them, the numbers are old (HUD foreclosure rates, 2008; New York Federal Reserve Bank, Third Quarter 2010). Some private entities (such as Realty Trac) publish limited free foreclosure information. However, they don't publish their methodology and an analysis of their figures suggest they may leave something to be desired.
However, for Metropolitan Statistical Areas (MSAs), I have found what looks to be some decent free and relatively up-to-date foreclosure data. This analysis of LPS Applied Analytics Data by the Local Initiatives Support Corporation (LISC) is well documented and on-going. And, their methodology is available so the data-user can understand the data itself. You can access their data by clicking here.
I've also thrown together some visualizations of their foreclosure data below. First some definitions:
Foreclosure Rate: Percent of all mortgages in the foreclosure inventory in the reference month. Mortgages in the foreclosure inventory include those in foreclosure and bankruptcy foreclosures prior to auction or trustee sale.
Prime Foreclosure Rate: Percent of all prime mortgages in the foreclosure inventory in the reference month. Prime mortgages are those that are Grade A, not a government product or government-insured, and either with 1) credit scores over 720 or 2) credit scores are from 680-719 with full documentation.
Subprime Foreclosure Rate: Percent of all subprime mortgages in the foreclosure inventory in the reference month. Subprime mortgages are those that a servicer coded as subprime or loans made to borrowers with FICO scores below 620 who did not receive a government, Fannie Mae or Freddie Mac loan.
Serious Delinquency Rate: Percent of all mortgages either 90 or more days delinquent or in the foreclosure inventory in the reference month.
90+ Delinquency Rate: Percent of all mortgages 90 or more days delinquent and have not yet entered into judicial or non-judicial foreclosure in the reference month.
Not surprisingly, Utah's poster child for the housing bubble, the St. George, UT MSA (Washington County), shows the rates for most worst measures. On the other hand, it still ranks far below some of the worst MSAs (many in Florida and also nearby Las Vegas). In June 2011, Washington County's foreclosure rate ranking measured 146 and its serious delinquency rate measured 130. The Salt Lake City MSA showed the next Utah highest rankings, while the Logan, UT-ID MSA showed the lowest foreclosure rankings. Hmmm. . .Utah MSAs with the most bubble-like increases in home prices (see the previous post) also show the highest foreclosure rates. While the MSA in Utah with the smallest home-price acceleration during the boom (Logan, UT-ID MSA) shows the lowest foreclosure ranking in Utah. Coincidence? I think not.
You'll also notice that all the Utah MSAs show a decline in serious delinquency rates since the national peak in foreclosures in December 2009. In this case, the St. George, UT MSA has shown the most improvement.
Tuesday, January 31, 2012
Provo women earn some of the lowest salaries in the largest U.S. Metropolitan Areas
Women in Provo have some of the lowest average salaries in the country, according to a Forbes analysis of the 2010 American Community Survey by the U.S. Census Bureau. Provo women are making on average less than $37,000 a year, according to the report. Provo women are making on average less than $37,000 a year, according to the report. Deseret News
Note:
Since I am interested in women's labor force issues and don't usually look at this type of data below the statewide level, I took the opportunity to look at the actual Forbes article. Forbes used 2010 American Community Survey data for "large" Metropolitan Statistical Areas (MSAs) and focused on females working year-round and full-time. Unfortunately for comparative purposes, Forbes doesn't tell us what they considered a large MSA.
With median female earnings for year-round, full-time workers of $31,400, the Provo/Orem MSA ranks 249 out of 374 MSAs nationwide. Incidentally, the "smaller" MSAs of Logan and St. George showed lower female median earnings ($27,100 and $26,700, respectively). Other large Utah MSAs appear higher in the rankings--Salt Lake ranks 154, while the Ogden/Clearfield MSA ranks in the 200 spot.
However, keep in mind that areas with low female earnings might also have low earnings for both genders. In other words, an MSA's low female earnings may be reflected in low male earnings as well. Cost of living, age of the labor force, industrial mix, etc. affects wages generally. . .not just for women. In my mind, the true question perhaps should be: How do men and women's earnings compare in Utah's most populous communities?
In 2010, U.S. median earnings for women working year-round, full-time measured 78.6 percent of the comparable male figure. (This wage gap has contracted decidedly in recent decades.) How do Utah's MSAs stack up? Honestly, not so great. The Ogden/Clearfield MSA shows a female/male wage ratio of 63 percent, the Provo/Orem MSA shows 65 percent ratio. Logan's ratio measures 70 percent, and St. George's figure is 71 percent. Even in Utah's best MSA performer--Salt Lake City--the female median wage measures only 74 percent of the male median wage. More than 70 percent of the nation's MSAs show female/male wage ratios better than Salt Lake City.
What's up? Why the low female-to-male wage rations in Utah? Undoubtedly many factors come into play. However, one major influence on the large difference in wages seems to come to the forefront. I call it the "education gap" and it is a primary factor behind Utah's larger-than-average wage gap. Statistically, there is a well-know relationship behind one's earnings and one's education. In general, the higher a person's level of education, the higher their earnings.
What's the education gap? By my reckoning, it is simply the percentage point difference between the share of the male population (over 25) with at least a Bachelor's degree and the share of the female population (over 25) with at least a Bachelor's degree. Nationally, there is a six-tenths of a point difference in the share of men and women with at least a Bachelor's degree (28.5 percent and 27.9 percent, respectively). In other words, in the U.S. there is currently very little difference between the share of men and women with a four-year degree or better.
The three MSAs with the largest male/female education gap in the nation? Number 1--Provo/Orem, Utah (11.3 percentage points). Neck and Neck for the number 2 spot--St. George, Utah (9.8 percentage points) and Ogden/Clearfield, UT (9.8 percentage points). Logan's performance is somewhat better--"only" a 4.2 point difference. The Salt Lake MSA managed the smallest Utah education gap--still large at 2.5 percentage points. Every single Utah MSA ranked among the 20 percent of MSAs with the largest education gaps.
Keep in mind that in 40 percent of the nation's Metropolitan Statistical Areas, a higher percentage of women have obtained a Bachelor's degree than have men. If Utah's women are falling far behind men in educational attainment, it should come as no surprise that they are falling far behind men in earnings.
Saturday, January 28, 2012
Utah hotel occupancy, rates up slightly
Utah occupancy and average daily room rate for hotels and motels were both up slightly in 2011. According to the Utah edition of the Rocky Mountain Lodging Report, the 2011 occupancy rate was 62.7 percent, up from 59.7 percent in 2010.
The average daily room rate for the year to date was $95.69, compared to $93.29 for 2010. Revenue per daily room rose as well, from $55.70 in 2010 compared to $60.04 for 2011. Salt Lake City recorded the best in 2011, with a 69.6 percent occupancy rate and average daily room rate of $93.65.
.
Ogden occupancy was at 60.7 percent, Cedar City at 53 percent, St. George at 60.1 percent, Logan and Utah County at 58.1 percent, and other Utah cities and towns at 61.2 percent. Salt Lake Tribune
Monday, December 19, 2011
Think tank ranks Utah cities among those best for business
The Milken Institute, founded in 1991 and based in California, has released a new list of best performing cities for the year. Salt Lake City, Provo and Ogden ranked in the Top 25 among large metro cities, while Logan ranked No. 1 among small cities. Logan skyrocketed from its No. 19 ranking in last year's list.
The research looked at 179 small cities and 200 large metros. In the large-city category, Salt Lake was ranked No. 6, Provo was listed at No. 9, and Ogden took the 15th spot on the list. St. George, which falls in the small-city category, was ranked 124th. No other Utah cities made the list. Herald Journal
The research looked at 179 small cities and 200 large metros. In the large-city category, Salt Lake was ranked No. 6, Provo was listed at No. 9, and Ogden took the 15th spot on the list. St. George, which falls in the small-city category, was ranked 124th. No other Utah cities made the list. Herald Journal
Tuesday, September 13, 2011
Most of Utah's Metropolitan Statistical Areas experience GDP growth in 2010
The U.S. Bureau of Economic Analysis just released annual Gross Domestic Product (GDP) estimates for Metropolitan Statistical Areas (MSAs) today. Remember that GDP represents the value of all goods and services produced in an area. Real (inflation-adjusted) U.S. GDP for metropolitan area increased an average 2.5 percent in 2010 after declining 2.5 percent in 2009. Growth proved widespread with real GDP increasing in 304 of 366 (83 percent) metropolitan areas, led by national growth in durable-goods manufacturing, trade, and financial activities.

In Utah, growth also dominated the figures with only the St. George, UT MSA displaying an annual decline in real GDP (down 1.6 percent). In general, GDP growth in Utah's MSAs registered below average. The Logan UT, MSA showed the most rapid expansion (4.0 percent).
For more information about the 2010 GDP figures for MSAs, click here.
Tuesday, August 9, 2011
New Total Personal Income Estimates at the Metropolitan Statistical Level
The U.S. Bureau of Economic Analysis (BEA) has just released 2010 total personal income estimates for U.S. Metropolitan Statistical Areas (MSAs). According to BEA, personal income rose in 2010 in all but four of the nation’s 366 metropolitan statistical areas. Fortunately, none of Utah's five MSAs ranked among those with declining personal income. On the other hand, some MSAs performed far better than others. Overall, personal income in the U.S. increased 2.9 percent between 2009 and 2010. Here's a few highlights of the MSA stats:

Logan, UT-ID MSA--Personal income in this MSA totaled $3.4 billion in 2010, an increase of 4.1 percent from the previous year. This ranked this MSA 53rd in terms of growth--the highest of any Utah area. This area also showed the highest gains in net earnings--3.4 percent.
Ogden-Clearfield, UT MSA-- In 2010, personal income in this MSA reached $18.2 billion reflecting a 2.7 percent gain over 2009. This MSA showed the third highest growth in personal income among Utah MSAs and ranked 197 (out of 366 MSAs) nationally.
Provo-Orem, UT MSA--With total personal income expansion of 2.8 percent, this MSA tied for second in the Utah ranking and 179 nationally in terms of 2010 growth. During 2010, total personal income measured roughly $13.4 billion.
St. George, UT MSA--This MSA showed the worst growth performance in the state. Between 2009 and 2010, personal income increased only 1.5 percent to equal $3.6 billion. Still suffering from the economic downturn, net earnings in this MSA dropped by 1.1 percent--the only decline among the Utah MSAs. Nationally, St. George ranked 344 for percent growth nationally.
Salt Lake City, UT MSA--Utah's most populous MSA experienced a 2.8 percent increase in total personal income during 2010. That places Salt Lake City in the number 176 spot for growth among MSAs nationwide. Here, total personal income is estimated at $43.6 billion.
For the complete release on personal income from the Bureau of Economic Analysis, click here.
Feds help pay for Utah’s flood damage
Utah will receive federal aid to pay for this spring’s flood damage. President Barack Obama signed a Utah disaster declaration and ordered federal funds to supplement the recovery effort from flooding between April 18 and July 16.
The funds are available to state, tribal and eligible local governments, and certain private nonprofit organizations, on a cost-sharing basis for emergency work and repair or replacement of facilities damaged by the flooding in the counties of Beaver, Box Elder, Cache, Daggett, Duchesne, Emery, Millard, Morgan, Piute, Salt Lake, Sanpete, Sevier, Summit, Tooele, Uintah, Utah, Wasatch and Weber, and the Uintah and Ouray Indian Reservation. The state could be eligible for $9.5 million in federal aid. Salt Lake Tribune
Wednesday, April 6, 2011
ATK lays off another 134 aerospace employees
On Tuesday, Alliant Techsystems Inc. informed 134 employees that they were out of work immediately. The end of the space shuttle program and a decision to change the focus of the next-generation ARES space exploration program led to the reduction in force, the fifth for the company’s aerospace division in the past two years.
The layoffs, which include 51 voluntary retirements, impact employees at ATK facilities in Promontory, Clearfield and West Valley City. The eliminated positions are across the board, from engineers and technicians to office workers. All will receive severance packages based on their years or service to the company. ATK’s aerospace systems division now has about 2,100 employees, 45 percent of its total in early 2009. Salt Lake Tribune
Wednesday, March 30, 2011
Has Utah's housing bubble deflated yet?

Housing bubbles aren't like most price bubbles. Typically, speculation drives up prices (of stocks, crude oil, and back in the 17th century even tulips) like an expanding bubble. Eventually, it becomes obvious that item is extremely over-valued and prices "pop" and collapse. Yes, that's why we call them bubbles.
Remember a couple of years ago when gasoline prices went through the roof? You can blame a bubble market in crude oil. (Some SEC reports indicated that 80 percent of crude oil trading during the height of that price expansion was speculative.) In just seven months, the producer price index (seasonally adjusted) for crude oil went from 339.9 to 108.8. That change represents a decrease of almost 70 percent! Talk about a popping bubble. (And, you might want to note the similarity to the current price increases in oil/gasoline.)
On the other hand, housing bubbles tend to slowly deflate rather than pop. Why? Think about it. If you bought a home at the height of the bubble for $400,000 do you really want to sell it for $250,000? No. Most private individuals aren't able to afford that kind of loss. For many American families, a home is their largest asset. So, if you must sell, you will keep trying to sell at a higher price until the market makes it clear that just isn't going to happen. In other words, home prices are sticky downward, so it will take longer for home prices to deflate after the speculation ends.
It also becomes readily apparent why there is such a foreclosure mess in this country. Obviously, many home-buyers took out loans they couldn't afford in the long run. Then, the recession exacerbated other home-buyers' ability to pay. In addition, even if home-buyers can afford to make their payments, aren't the incentives skewed towards walking away rather than paying off the $400,000 mortgage on a home that is now worth only $250,000?
Well, this housing bubble has certainly taken its time collapsing. However, the market is working her magic and there does seem to be light at the end of the tunnel--at least according to the Federal Housing Finance Agency's Housing Price Index (HPI). (For more information on the HPI see this previous post or the Agency's website.)
(Click on image to enlarge.)
The chart that accompanies this posting certainly provides a lovely portrait of a housing market bubble for Utah's Metropolitan Statistical Areas (MSAs)--particularly for my own Washington County. You can watch home prices explode and then collapse (the chart shows the percent change compared with the same quarter a year ago--which eliminates seasonality).
The Logan, UT MSA (Cache County) seemed to participate the least in the run up of home prices and also appears closest to the end of the price declines. As of fourth quarter 2010 (the most recent index available):
- Logan home prices are down only 1.0 percent compared with prices in fourth quarter 2009.
- Ogden-Clearfield MSA home prices are down 1.8 percent.
- Salt Lake City MSA prices are down 2.0 percent.
- Provo-Orem MSA prices are down 2.4 percent.
- St. George MSA prices still show the largest price declines--4.8 percent.
Wednesday, March 16, 2011
As USTAR’s budget falters, its federal grants soar
USTAR is enjoying a banner year pulling in research grants, topping $22 million in the first half of fiscal year 2011. The U.S. Department of Energy is this year’s major funder of the Utah Science, Technology and Research initiative, with a $5 million extension to an existing grant to the University of Utah to hunt promising geologic formations for “sequestering” carbon dioxide. Another $10 million went to Utah State University. Salt Lake Tribune
Wednesday, February 23, 2011
Metropolitan GDP figures released

The U.S. Bureau of Economic Analysis (BEA) has just released 2009 estimates of Gross Domestic Product for Metropolitan Statistical Areas (MSAs) across the nation. (Yes, that's not a "typo" 2009 data is the most recent information available for MSAs.) Given the economic downturn, it may be surprising that only 80 percent (292 of 366) of the nation's MSAs experienced a decline in real (inflation-adjusted) gross domestic product.
How did Utah's MSAs perform? Three of five Utah MSAs showed an increase in gross domestic product in 2009--Logan, Salt Lake City, and Ogden-Clearfield. In fact, the Salt Lake City MSA (which includes Salt Lake, Tooele, and Summit counties) placed in the top quintile of all MSAs. The gains weren't phenomenal (just under 1 percent), but during a recession, any gains are certainly welcome.
The St. George, UT MSA (Washington County) produced the worst Utah decline in GDP during 2009--3.4 percent. Of course, the St. George area participated in housing market speculation to a much greater degree than any other area in the state. Indeed, Washington County's decrease placed it in the lowest quintile of all MSAs. It's performance ranking? It ranked 310 out of 366 MSAs. In addition, Provo-Orem experienced a 1.7 percent drop.
For more information on recent GDP performance: http://www.bea.gov/newsreleases/regional/gdp_metro/gdp_metro_newsrelease.htm

Home prices hit post-bust lows in most big cities
Home prices in a majority of major U.S. cities tracked by a private trade group have fallen to their lowest levels since the housing bubble burst. The Standard & Poor’s/Case-Shiller index fell in December from November in all but one of the 20 cities it tracks. The 20-city index declined 1 percent.
The only market to see a gain was Washington, D.C. Along Utah’s Wasatch Front, according to a Jan. 27 report, the residential real estate market, mired in one of the worst downturns ever, is showing a few signs of improvement.
In Salt Lake County, 1,934 existing single-family homes were sold in the fourth quarter of 2010, down 21 percent compared with the fourth quarter of 2009, according to the Salt Lake Board of Realtors. The median selling price was $215,000, down 4.4 percent from the same three-month period in 2009 and off a peak of $256,000 in the summer of 2007. Salt Lake Tribune
Note: The Federal Housing Finance Agency also publishes the Housing Price Index for all Metropolitan Statistical Areas (MSAs). The following chart shows the year-to-year change in the index for Utah MSAs. The most current index is for third quarter 2010. A bottom to housing prices according to this chart would occur when the year-to-year is equal to zero. At this point, the Logan, UT MSA is closest to a bottoming in prices, followed by the Ogden-Clearfield MSA. Not surprisingly, these two areas experienced the lowest level of speculation in the housing market. You can access this information at: http://www.fhfa.gov/Default.aspx?Page=14

Thursday, February 17, 2011
Murray and Logan stores to close in Borders bankruptcy
Borders was slow to get the message as the big-box retailer lost book, music and video sales to the Internet and others. As a result, it filed for Chapter 11 bankruptcy Wednesday, and will close a third of its stores, including two in Utah.
Border plans to close by the end of April about 200 of its 642 stores, including Utah locations in Murray at 132 E. Winchester and in Logan at 1050 N. Main Street, costing about 6,000 of the company’s 19,500 employees their jobs. The location in Provo at 4801 N. University Ave. is not on the closure list. Salt Lake TribuneFriday, February 4, 2011
Rebound comes too late for 7 Utah restaurants
Six eateries owned by national chains and the independent Acme Burger Co. in downtown Salt Lake City have closed. In Utah, restaurant sales taxes paid during fourth quarter of 2010 increased more than $350,000, compared with the same period a year earlier.
But not everyone is prospering as the eateries and their customers adapt to new economic realities. Five Ruby Tuesday outlets in Utah closed in January, leaving only the Park City franchise at 6585 N. Landmark Drive. The shuttered restaurants were in Draper, West Jordan, West Valley City, Logan and St. George. The closings cost at least 200 employees their jobs.
Also shut down were the Lone Star Steakhouse in Sugar House at 1206 E. 2100 South, and Acme Burger, 275 S. 200 West. Acme, a small independent eatery known for grass-fed beef and good reviews, was closed for nonpayment of taxes. It opened in 2007. Salt Lake Tribune
Note: What this article fails to mention is that there have also been numerous openings of restaurants during the past year. Even in the best of times, some restaurants fail and others open. Our most current data (September 2010) actually shows more Utah restaurants in business this year than the year before.
Saturday, January 22, 2011
For Utah hoteliers, 2010 better but not real good
Compared with a year earlier, occupancy rates last month were up 1.7 percent statewide and 2.6 percent in Salt Lake County. With those lukewarm results, hotels statewide finished the year with a 59.7 percent occupancy rate, up from 56.9 percent in 2009. Although an improvement, the number of rooms filled nightly remained significantly below levels in 2008 (63.7 percent) and 2007 (68.4 percent). In addition, the downturn continued to impact the amount of money hoteliers could charge for their rooms. The average nightly room rate in 2010 was $93.29, about 75 cents cheaper than a year earlier but $5 a night below the going rate in 2008.
The Lodging Report breaks Utah down into nine areas. Six regions had better years in 2010 than in ’09, led by 4.9 percent gains in Logan and 4.4 percent gains in St. George. Scattered hotels outside of Utah’s main metropolitan areas did even better, filling 5.2 percent more rooms than a year earlier. Small declines occurred in Ogden and Davis County. Salt Lake Tribune
Thursday, September 23, 2010
State’s $1.25B bond offering largest ever
Utah is getting ready to issue $1.25 billion in bonds, its largest debt offering ever. The state expects to offer the bonds for sale later this week after it determines the interest rate they will carry. “Things are looking pretty good in terms of our borrowing costs,” said State Treasurer Richard Ellis, indicating he anticipates the interest rate should be lower than that for last year’s $1 billion bond offering. Those 15-year bonds carried a 2.99 percent interest rate. By paying lower interest on the money it borrows, the state and its taxpayers save money.
The bulk of the proceeds from the bond offering will be used to fund the continued renovation of Interstate 15. However, a little less than $100 million will be directed toward construction of several buildings at the University of Utah and Utah State University. The Salt Lake Tribune
Wednesday, June 30, 2010
Utah career college to hire 300 to meet demand
Stevens-Henager College is looking to add 300 jobs this year, positions it says are needed to service an influx of students using recession-driven downtime to increase their educations.
The private career college, founded in Salt Lake City in 1891 and now part of a group called CollegeAmerica Services Inc., is advertising for a variety of positions, from admissions representatives to instructors and managers.
Salary levels will range from $30,000 per year for some entry-level positions to a base salary of $175,000 for an upper-level manager, said Eric Juhlin, CEO of CollegeAmerica Services. The Salt Lake Tribune
Subscribe to:
Posts (Atom)