 The biennial update to Utah's occupational projections have been released and can be found here: http://www.jobs.utah.gov/wi/pubs/outlooks/state/index.html. But first. check out these highlights:
Cache County Highlights
Matt
Schroeder, Regional Economist
The
projected occupational growth rate in Cache County is slightly below the rest
of the state on average at 2.3 percent annually through 2024. Utah statewide
projected growth is 2.7 percent. The 2,530 projected annual openings in Cache
County from 2014 to 2024 represent about 4 percent of all projected openings in
the state.
The occupations
with the highest growth expectations are, on average, those that require the
most education. Jobs that typically require a doctoral or professional degree
are projected to grow 2.7 percent annually through 2024. Growth in openings for
physicians, physical therapists and psychologists are driving this trend.
Expectations
for healthcare practitioners and healthcare support occupations in Cache County
are worth highlighting. The healthcare industry is supplying large numbers of
annual openings and is expected to grow at more than 3 percent every year over
the next eight years. Registered nurses have the strongest demand outlook among
healthcare jobs, with expected growth of 3.7 percent or about 40 openings a
year, and they earn median wages of nearly $58K per year. Nursing, medical and
dental assistants are also expected to be in demand with about 60 openings per
year combined. These jobs offer median wages between $22K and $28K per year,
but require less education.
After
registered nurses, perhaps the most noteworthy occupations in terms of expected
demand and wages are applications software developers, mechanical engineers and
accountants/auditors. Jobs such as these in the areas of business/finance,
engineering and information technology, tend to offer high wages for the level
of education required and consistently exhibit a strong growth outlook. Application
software engineers are projected to grow by about 3.2 percent or 20 openings
per year in Cache County. They typically require a bachelor’s degree and earn
median wages of $69K per year. Similarly, accountants and auditors are
projected to grow by about 3.2 percent or 20 openings annually and earn median
wages of $55K per year.
There are
many other occupations in the region that are projected to offer excellent
opportunities as well — electrical engineers, mechanical engineers, engineering
techs, cement masons and concrete finishers, environmental science techs, and
management analysts just to name a few. You can learn more about these
occupations and others through the Utah Occupational Explorer
where you can explore and compare occupations of interest in detail by region,
wage level, typical education required, projected growth, and demand. Before
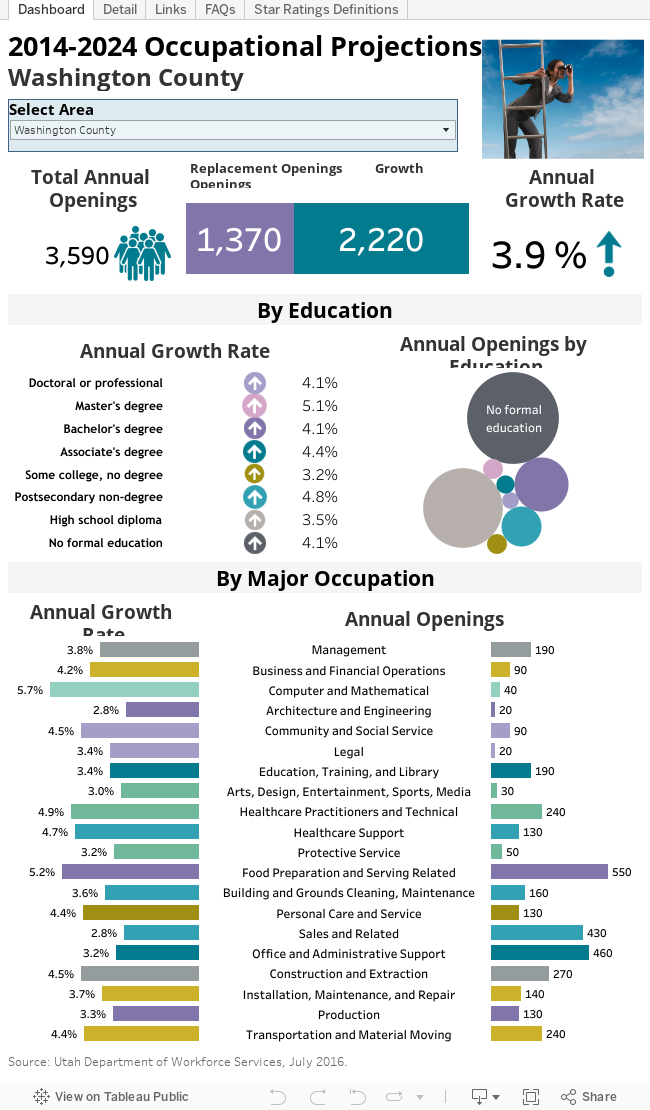
digging into the details though, take a look at the interactive data visualization above to see the big picture of the occupational outlook for Cache County.
About Utah's Occupational Projections
While a Utah
statewide profile leads the way, Utah’s local economies are not homogenous;
therefore, nine Utah subregions are also profiled. Due to confidentiality
restraints and statistical reliability, the amount of occupations available
will diminish the smaller a subregion; but, occupations comprising the backbone
of a regional economy will be available.
About Utah's Occupational Projections
Mark Knold,
Supervising Economist
“The
government knows everything about everyone.”
Fortunately,
that statement is not true. Yet society still looks to the government to
provide answers to comprehensive and complex questions that have their
foundation within individual decisions and activities. One subject frequently
directed toward the government is individual-level information about the
economy — particularly, what occupations are in demand, what occupations pay well
and have lucrative outlooks, and ultimately, what occupation(s) should I build
my career upon?
It takes the
accumulation of a wide array of individual information to answer these
questions. Employers provide the foundation information about the occupations
they employ. Jobs are held by individuals, but employers provide the profile
information about the job itself, not any particular individual.
Since
society desires to profile such a broad spectrum of the economy — occupational
profiles and the occupational distribution within the economy — only government
is in the unique position to collect, analyze and provide answers for said
desire. Yet, no government program or regulatory agency mandates any
comprehensive occupational reporting from individuals or businesses. Therefore,
government attempts to fill the void with an ongoing, robust and voluntary
survey of employers — a survey where employers are asked to provide details
about their various occupations, including descriptions, quantities,
wages/salaries and location. Through this survey emerges an occupational
portrait of an economy.
The U.S.
Bureau of Labor Statistics (BLS) structures and funds the survey, yet the
individual states conduct the survey. Under BLS administration, all states use
the same methodology; therefore, occupational profiles are comparable across
states.
Through this
survey, analysts discover how industries are populated with various
occupations. Accountant is an occupation, yet accountants can be found across
many different industries. Other occupations may be more exclusive to certain
industries; for example, doctors are largely found only in the healthcare
industry. One of the survey’s products is that industries can be profiled with
their general mix of occupations. This is called an industry’s occupational
staffing pattern.
This brings
us back to the original questions: what occupations are in demand, what
occupations pay well and have lucrative outlooks, and ultimately, what
occupation(s) should I build my career upon?
The
foundation is to make informed forecasts about how industries will
expand/contract over the next 10 years. By applying existing occupational
staffing patterns to each industry’s projected change, a trained economic
analyst can then make an extrapolation about how occupations will
correspondingly increase/decrease. Knowledgeable analyst judgment further
refines the occupational expectations, such as knowing an occupation will grow
faster than in the past, with the result being a set of occupational projections
that accumulate to profile a state or regional economy.
A new set of
occupational projections are done every two years to keep the information fresh
even though economies do not change dramatically in short order. Because of
slow change, updated occupational projects generally continue the overall
message of preceding occupational projections. But economies do modify with
time, and therefore, subtle changes will arise with each new set of
occupational projections.
Utah’s most
recent occupational projections are found here: http://www.jobs.utah.gov/wi/pubs/outlooks/state/index.html.
These projections look forward to the year 2024.
The
occupational profile is structured from the general to the detailed, mimicking
the structure of a family tree. First, broad occupational categories are
defined, such as management or healthcare occupations; then, subcategories are
defined; and finally, individual occupations are defined. Individual occupations
are the heart of the occupational projections. But overall patterns and
characteristics do emerge when observing the broader categories.


