- Rich County saw payroll employment grow at the slowest year-over rate of the three counties in the Bear River region. From second quarter 2013 to second quarter 2014 the county added 15 jobs, a growth rate of 2.2 percent. Retail trade shrank 20.1 percent and shed the most jobs (13) of any industry.
- Although job growth in the county came in below the Utah average, the unemployment rate continues to fall. The rate settled at 2.3 percent in September, which is among the lowest figures in the state. Like Cache County, the slack in the labor market is dissipating dramatically in 2014.
- The tightening of the labor market might be reflected in the county’s quarterly increase in average monthly wages, which increased 2.6 percent from 2013. It is also likely that this quarterly increase is in part a reflection of losing several jobs in a low-paying industry like retail sales.
- Second quarter 2014 taxable sales in Rich County were down significantly from 2013, but the data are skewed by the inclusion of adjustment for prior periods (similar to Box Elder County). If these adjustments are excluded, the county actually experienced a healthy 6.8 percent increase in taxable sales over the year.
- Two fewer homes were sold in third quarter 2014 (17) compared to the year prior (19), and year-to-date data point to a consistent downward trend in 2014 home sales (down 42.6 percent).
Showing posts with label Data. Show all posts
Showing posts with label Data. Show all posts
Thursday, November 20, 2014
Rich County Economic Indicators
The Bear River region felt the effects of the downturn starting in 2009, when the labor market shed 3,795 jobs from the previous year. For the next two years, the region lost jobs (though Cache County contracted in 2009 only). The tide turned in 2012 when annual job gains in Cache and Rich counties outweighed job losses in Box Elder County. And while regional momentum continued to build in 2013, Bear River’s year-over growth measured consistently slower than the state average. So far, 2014 appears to be a different story with regional employment outpacing the rest of the state through the first six months of the year.


Cache County Economic Indicators
The Bear River region felt the effects of the downturn starting in 2009, when the labor market shed 3,795 jobs from the previous year. For the next two years, the region lost jobs (though Cache County contracted in 2009 only). The tide turned in 2012 when annual job gains in Cache and Rich counties outweighed job losses in Box Elder County. And while regional momentum continued to build in 2013, Bear River’s year-over growth measured consistently slower than the state average. So far, 2014 appears to be a different story with regional employment outpacing the rest of the state through the first six months of the year.
- Year-over payroll employment in Cache County grew 3.3 percent in second quarter 2014. The rate of growth was the same for both the goods-producing and the service-providing sectors. Financial activities, leisure/hospitality, professional/business services, and construction all grew faster than 5 percent compared to the previous year, adding a combined 928 jobs over the year.
- Cache County boasted one of the lowest seasonally-adjusted unemployment rates in the state at 2.7 percent in September. The unemployment rate in the county has measured below 3 percent since March. Such low levels of unemployment are not unheard of in Cache County, but the relatively low rate suggests that the county’s job market is getting considerably more competitive.
- Average monthly wages in second quarter increased 1.7 percent from 2013. And while Cache County’s wage growth was perfectly aligned with the Utah average, the average monthly wages paid in the county totaled $795 less than Utah’s $3,396 per month.
- Cache County’s year-over changes in taxable sales increased for the ninth consecutive quarter. Second quarter 2014 taxable sales in the county totaled just over $370 million, an increase of 2.9 percent from second quarter 2013. Manufacturing business investment figures – the sixth largest industry by sales totals – posted the most notable gain of 16.1 percent.
- In Cache County, 336 homes sold in third-quarter 2014, a decline of 12.5 percent from the previous year. The year-to-date total from 2013 to 2014 indicates that that decline is slightly exaggerated by quarterly volatility, but growth in the housing market seems to be slowing from last year’s pace.
Box Elder County Economic Indicators
The Bear River region felt the effects of the downturn starting in 2009, when the labor market shed 3,795 jobs from the previous year. For the next two years, the region lost jobs (though Cache County contracted in 2009 only). The tide turned in 2012 when annual job gains in Cache and Rich counties outweighed job losses in Box Elder County. And while regional momentum continued to build in 2013, Bear River’s year-over growth measured consistently slower than the state average. So far, 2014 appears to be a different story with regional employment outpacing the rest of the state through the first six months of the year.
- Box Elder payroll job growth in second quarter 2014 accelerated to an annual rate of 4.0 percent, the seventh fastest year-over job growth in the state and 1.2 percentage points faster than the Utah average. In total, the region added 670 jobs from second quarter 2013. Construction and manufacturing firms had notable gains of nearly 13 percent and 6 percent, respectively. Manufacturing industry growth is a particularly positive indicator of improving economic health.
- The county’s seasonally-adjusted unemployment rate fell to 3.9 percent in September. The last time Box Elder County had an unemployment rate under 4.0 percent was August of 2008. Despite the positive trend, the unemployment rate still registers 0.4 percentage points higher than the state average of 3.5 percent.
- Although the labor market in the county picked up steam in second quarter 2014, average wages in the county continued to sputter along. Year-over wage growth equated to 0.9 percent, nearly 1 percentage point slower than the Utah rate of 1.7 percent. As the labor market gets tighter, there should be upward pressure on employee compensation, but it could be some time before consistently higher wages materialize.
- Box Elder experienced a 15 percent decline in taxable sales from second quarter 2013 to second quarter 2014. The majority of the decline in taxable sales for the county came from adjustments for prior periods, which does not reflect normal business transactions. Excluding these adjustments from second quarter taxable sales results in a 5.9 percent increase from 2013 to 2014 (consistent with the recent growth rates).
- Year-over home sales dipped 7.7 percent in third quarter of this year according to the Utah Association of Realtors. Though the housing market has come a long way since 2009, sales across the state were flat in between the third quarters of 2013 and 2014.
Thursday, September 4, 2014
Long-Term Employment Projections
The value in providing these projections is to help identify which types of jobs are most likely to be in high demand in the future. Ultimately, the long-term employment projections act as a forecasting measure by which individuals as well as organizations and agencies can plan ahead.
See the latest long-term projections produced by DWS for the Bear River area.
Friday, August 29, 2014
A Story of Wage Data
 The Wages and Income page has a new look to the wage data that is gathered by the Workforce Research and Analysis division. Along with visualization of the data, you can now read story points at the top of each graph, to help understand what the data is showing you along with highlighting its insights. Just click along the story points at the top of the visualization to follow the story of wages.
Friday, February 28, 2014
Hard at Work, Women in the Utah Labor Force
Hard at Work, Women in the Utah Labor Force has been updated on the DWS site into an interactive data visualization. See a snapshot of the visualization below.

Tuesday, October 1, 2013
Upswing in U.S. Manufacturing & the Implications for Northern Utah
Tyson Smith - Economist
Recently, there have been a number of indicators suggesting that domestic manufacturing is gathering momentum (here, here and here, for example). And while market forces have been working against keeping production in the United States for decades, we are starting to see economic incentives for “reshoring” manufacturing. The financial advantages of outsourcing production to countries with lower labor costs still exist, but the margins for doing so are thinner than they were as recently as 10 years ago. Furthermore, the shift toward automated production has put a higher premium on skilled labor versus inexpensive labor.
Recently, there have been a number of indicators suggesting that domestic manufacturing is gathering momentum (here, here and here, for example). And while market forces have been working against keeping production in the United States for decades, we are starting to see economic incentives for “reshoring” manufacturing. The financial advantages of outsourcing production to countries with lower labor costs still exist, but the margins for doing so are thinner than they were as recently as 10 years ago. Furthermore, the shift toward automated production has put a higher premium on skilled labor versus inexpensive labor.
Even though the aforementioned structural shifts toward “reshoring” have encouraged increases in domestic manufacturing, the majority of the gains in output over the last 3 years have been a result of the global economy recovering from the Great Recession. The pertinent question for us to examine is: How has the recovery affected employment in the manufacturing industry in Northern Utah?
Wednesday, September 18, 2013
MSA Gross Domestic Product estimates released
The U.S. Bureau of Economic Analysis just released 2012 Gross Domestic Product (GDP) estimates for Metropolitan Statistical Areas (MSAs) in the United States. On average, MSA real GDP (adjusted for inflation) increased by 2.5 percent in 2012—slightly lower than the total U.S. average of 2.8 percent.
Nationally, Texas and Indiana dominated the rankings for the fastest-growing MSAs. Each of these states placed three MSAs among the top ten. The New Orleans and San Francisco MSAs showed the fastest-growing large MSA economies.
Nationally, Texas and Indiana dominated the rankings for the fastest-growing MSAs. Each of these states placed three MSAs among the top ten. The New Orleans and San Francisco MSAs showed the fastest-growing large MSA economies.
Wednesday, March 13, 2013
Box Elder Highlights
Did you know that in 2011, Box Elder County had a population estimate of 50,466? It may not be a surprise to find out that Brigham City is the county’s largest city with an estimated 17,899. But did you know that its next largest city Tremonton had an estimated 7,647 in that same year? You can find these quick facts below, and much more including construction, employment income, largest employers, sale and wages by visiting Box Elder eProfiles.
For more county eProfiles, see here.

For more county eProfiles, see here.
Monday, February 25, 2013
2011 Advance GDP by Metropolitan Area Released
The U.S. Bureau of Economic Analysis recently released gross domestic product estimates for the nation’s 366 metropolitan areas. In 2011, metropolitan area growth registered an average of 1.6 percent—just slightly higher than the U.S. total (1.5 percent). However, the growth rate for metro areas dropped noticeably from the 2010 expansion of 3.1 percent.
Only 242 of the nation’s metropolitan areas experienced a 2011 gain in GDP. However, all of Utah’s metro area’s showed increases equal to or greater than the U.S. metro average. Both Ogden/Clearfield and Provo/Orem generated gains of greater than 5 percent. Lowest on the scale proved the Logan metro area with a gain of only 1.6 percent. For more information on the current release, click here.
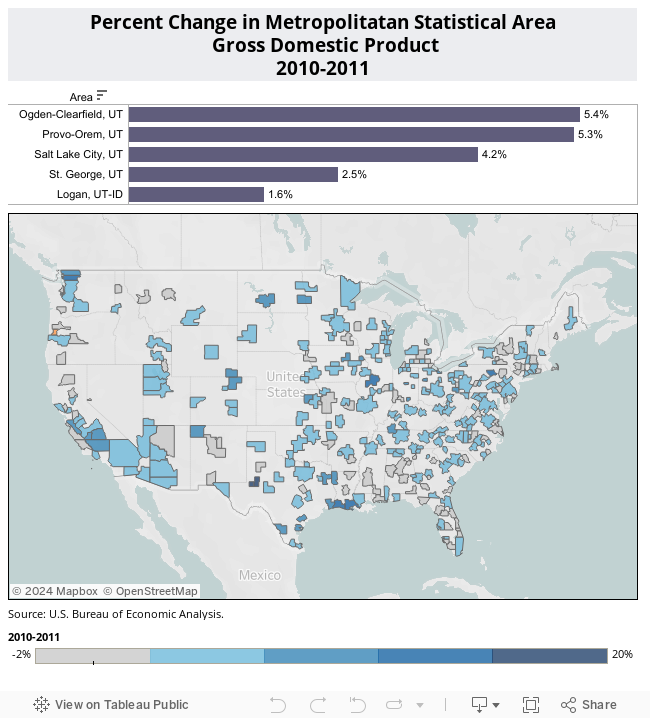
Only 242 of the nation’s metropolitan areas experienced a 2011 gain in GDP. However, all of Utah’s metro area’s showed increases equal to or greater than the U.S. metro average. Both Ogden/Clearfield and Provo/Orem generated gains of greater than 5 percent. Lowest on the scale proved the Logan metro area with a gain of only 1.6 percent. For more information on the current release, click here.
Thursday, September 6, 2012
Utah’s pollution-cutting plan moves on despite resistance

With proposals to expand auto-emissions inspections, encourage public transit and cut industrial pollution, the sweeping emissions-cutting plan would impact all those living and doing business in the state’s inversion-plagued urban areas. And that explains why one area — Cache County —already has balked at implementing a key regulation: requiring its residents to begin emissions testing on cars and trucks.
Even though the state’s air-pollution experts have been working on the plan for more than two years, it still falls short of the health-based pollution standards the U.S. Environmental Protection Agency is requiring states to meet by 2014. And while harmful PM 2.5 pollution will be cut significantly, regulators continue to search for still more reductions in the microscopic soot that builds up in the basins during winter inversion periods.
EPA standards allow a daily average of up to 35 micograms per cubic meter of PM 2.5 pollution in the air for no more than seven days a year, but that limit is exceeded as many as 30 times some winters. (On the other hand, the state easily meets the annual average limit of 15 micograms of PM 2.5)
In Salt Lake County, another 5 percent reduction in emissions is needed even with a five-year deadline extension to 2019. New data from fast-growing Utah County shows further reductions of more than 10 percent in emissions would be needed to meet EPA limits there. With an emissions-testing program, Cache County is expected to meet the EPA standard. Salt Lake Tribune
Subscribe to:
Posts (Atom)