Showing posts with label Employment. Show all posts

Wednesday, January 27, 2016

How educated is Bear River's workforce?
It depends on how you look at it — based on where they work or where they live.

Matt Schroeder, Regional Economist

Local leaders have become increasingly aware of the relationship between the education level of their local workforce and the economic strength of their communities. Higher levels of education are closely linked to higher incomes for individuals; which, in turn, brings in higher tax revenues and lower government social program costs. People with higher education levels tend to be healthier, more involved in community organizations and give more to charity. They are also less likely to be chronically unemployed, less likely to require social assistance, and have lower incarceration rates.

More broadly, when businesses look to expand or locate in a particular area, one of the primary factors they consider is the availability and training of the local workforce. A region with a more highly educated labor pool will tend to draw businesses that need highly educated employees. Those jobs, in turn, tend to garner higher wages. Higher wages mean more consumer spending and tax revenue for local governments, which allow for investment in infrastructure, public services and community development.

These benefits have long been known and I mention them to highlight why so much emphasis is often placed on education in the public arena. It really matters for community health and development. But there is an interesting question to this issue that is seldom explored when we think about how to better educate our local workforce: Should we focus on the education levels of the people who live in our communities, or on those who work in our communities?
To clarify, we’re talking about community investment in increasing higher education attainment levels, not the funding of primary and secondary education. On the resident workforce side, this may include expanding post-secondary degree programs and institutions, or encouraging and supporting student enrollment in higher education. On the working workforce side, higher levels of educational attainment are achieved by growing the number of jobs that require higher levels of education. Community investments to achieve this may include developing infrastructure and facilities to meet the needs of businesses, incentives for target industries.

For a local city or county considering investing in these types of development projects with limited funds, where should their focus be? This is an especially relevant question in an area like Bear River where the local commuting patterns are very fluid. Thousands of commuters flow along I-15 and Hwy 89 every day to jobs in other cities and counties. A well-educated engineer, for example, may be living in Brigham City, but commutes up to Logan every day for work. Should local leaders be concerned with developing a better-educated resident workforce if they are likely to just commute somewhere else for work? Or should the community be more focused on bringing in the kinds of jobs that will help keep an already well-educated population working closer to home?

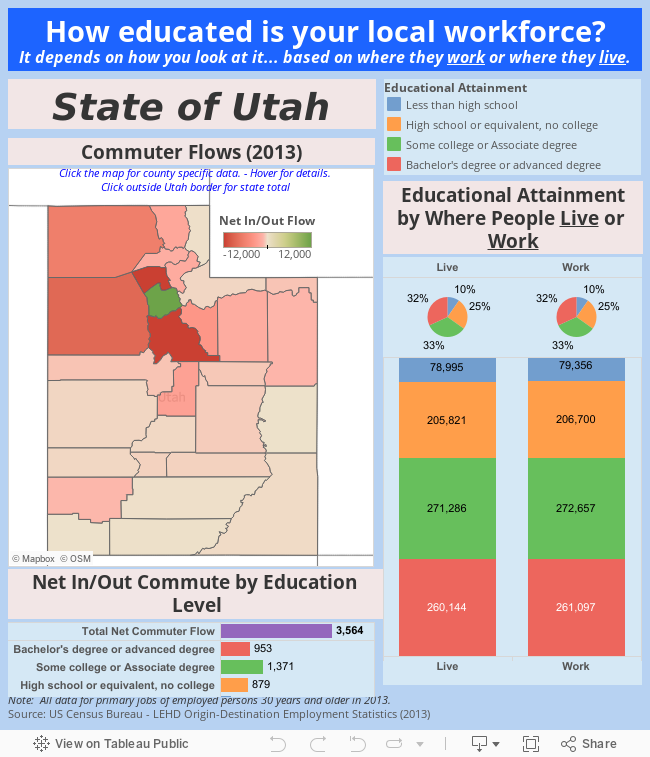
The answers to these questions depend on the specific characteristics of local economies, and unfortunately, no single answer or formula can be applied across the board. As a start, it helps to first have a picture of what’s actually happening. The interactive data visualization above allows you to see the situation for your county. Click on the map to see your county and hover over each chart to see details and an interpretation of the data.

In Box Elder, Cache and Rich counties more people commute out for work than come in. Of the three, Box Elder County has the largest net outflow, with more than 6,400 net out-commuters representing about 35 percent of the resident workforce. Of those 6,400, about 30 percent, or nearly 1,900 net out-commuters, have a bachelor’s degree or higher. The share of workers with a bachelor’s degree living in Box Elder County is 27 percent while the share working there is 26 percent. This is a relatively balanced out-flow in terms of educational attainment, but the fact remains that nearly 1,900 highly skilled workers are leaving every day for work. Ease of access to the rest of the Wasatch Front via I-15 and the short commute up to Logan make this possible, but many would likely stay closer to home if the jobs existed to support them.

Cache County has far fewer out-commuters in both percentage terms and in total numbers. The net out-flow of about 2,200 workers represents just 7 percent of the resident workforce and fewer than 600 of those leaving have a bachelor’s degree or higher. The result is that the share of workers with a bachelor’s degree or more working in Cache County is actually higher than the share of those living in Cache County — 31 percent vs 30 percent.

Rich County also has relatively little out-flow. More people commute out for work than come in, but the net outflow of 52 represents only 12 percent of the resident workforce. However, 33 of those 52 out-commuters have a bachelor’s degree or higher. The resulting share of people working in the county with that level of education is much lower, at 25 percent, than the share living in the county, at 29 percent.

Each of these counties is distinct in terms of the factors that play into why their worker flow patterns exist. For Box Elder and Rich Counties, there is clearly a current resident population more educated than the local job market demands. It may be worth exploring the possibility that those areas may benefit from a greater focus on high-skilled job creation. Cache County, on the other hand, is more balanced in terms of the share of highly educated workers that live and work there, so they may benefit most from a two-pronged approach that seeks to bring in higher skilled jobs while at the same time building the workforce to fill them.

Wednesday, November 4, 2015

Agricultural Employment – The Census of Agriculture Gives a More Complete Picture

By Matt Schroeder, Regional Economist

Farming, (or more generally, agriculture) is obviously an important part of the economy, so why is that when you hear employment statistics reported in the news, you typically hear them reported as “nonfarm” employment?

“Nonfarm payroll employment” is terminology from the Bureau of Labor Statistics’ Quarterly Census of Employment and Wages (QCEW), and the term is slightly misleading. There is, in fact, some data on agricultural employment in the QCEW data typically reported, it’s just not complete. QCEW employment data is based on administrative records from employers who pay into the state’s Unemployment Insurance (UI) program, so workers not covered under UI laws are not captured. Agricultural employers are generally exempt from the requirements for UI coverage, so the data are simply not comprehensive enough to calculate reliable estimates. Furthermore, many agricultural operations are sole-proprietorships that are also exempt from UI coverage (whether in agriculture or not), so those individuals are not recorded either.

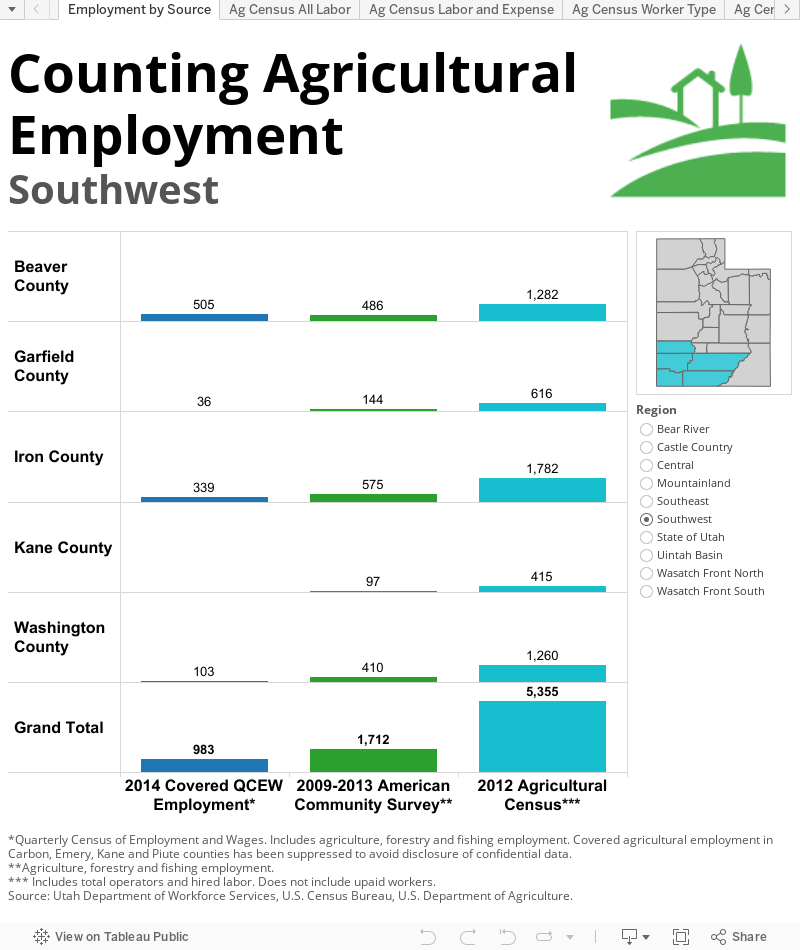
All of this comes down to the fact that the typical “nonfarm” employment statistics you hear about in the news, on average, do not include roughly 90 percent of Utah’s agricultural employment. In 2012, QCEW reported fewer than 5,000 employees in “Covered Agriculture,” for the whole state, which represented less than one half of one percent of Utah’s total employment.

Fortunately, the Census of Agriculture, conducted by the U.S. Department of Agriculture once every five years, gives a revealing picture of the agricultural sector. The most recent data, covering 2012, were released last May 2015. The Agricultural Census surveys all of those UI-exempt farms that the QCEW misses and found that there were nearly 47,000 jobs in agriculture in 2012 — more than 3.5 percent of Utah’s total employment.

In the Bear River region, agriculture is an even larger share of the local economy — nearly 10 percent according to the Census of Agriculture. Box Elder and Cache counties respectively rank 2nd and 3rd in the state in terms of total agricultural employment. Rich County is relatively small in total number, but the share of jobs in agriculture is more than 45 percent.

Monday, August 3, 2015

Rich County Economic Update

Rich County Better Off Than It Looks in Early 2015

By Matt Schroeder


Rich County appeared a little slow out of the gate in early 2015, but this is primarily due to a single employer and does not suggest broad concern for the overall economy. In fact, other indicators suggest that the outlook for Rich County is quite good. Employment in leisure and hospitality is growing quickly, taxable sales are up, and new construction of retail structures signals increasing consumer demand. Overall, the indicators are reaffirming that the long term trajectory of economic performance for the county is positive.

Cache County Economic Update

Cache County Continues Steady Growth in Early 2015

By Matt Schroeder


Cache County began 2015 with solid, consistent economic performance. Taxable sales were up more than 7.3 percent with particular strength in retail markets. Employment growth was steady and broad-based at 2.6 percent despite an extremely low unemployment rate. Wages are still relatively flat, but overall, the indicators are reaffirming that the long term trajectory of economic performance for the county is still positive.


Box Elder County Economic Update

Box Elder County Picking Up Steam in Early 2015

By Matt Schroeder


Box Elder County has picked back up in early 2015. Employment growth improved markedly after a lull in late 2014. Taxable sales were up with particular strength in motor vehicles thanks in part to low oil prices. Unemployment remained low and initial unemployment insurance claims are back to pre-recession levels. Wages are still flagging a bit, but overall, the indicators are reaffirming that the long term trajectory of economic performance for the county is still positive.

Monday, April 27, 2015

Box Elder County Economic Update

Box Elder County Ends 2014 with Solid Economic Performance

By Matt Schroeder

Despite a little slowing in job growth, Box Elder County ended 2014 on a relatively positive note. Wages, which have been slow to keep up with the rest of the recovering labor market, finally turned a corner. Taxable sales were up with particular strength in motor vehicles thanks in part to falling oil prices. Unemployment continues to fall and initial unemployment insurance claims are back to pre-recession levels.  Employment growth slowed a bit, but overall, the roots of recovery appear to be firmly set in the region and Cache County’s economic performance at the end of 2014 leaves continued-optimism for 2015 as the rational expectation.

Cache County Economic Update

Cache County Ends 2014 with Solid Economic Performance

By Matt Schroeder


Cache County ended 2014 with steady job growth and deepening consumer confidence. Taxable sales were up more than 5 percent with particular strength in retail markets. Motor vehicle sales were particularly strong thanks in part to falling oil prices. Unemployment in Cache is the lowest in the state.  Employment growth was not particularly impressive, but it was consistent and relatively broad based.  Wages, which have been slow to keep up with the rest of the recovering labor market, are still exhibiting lackluster growth, but overall, the roots of recovery appear to be firmly set in the region and Cache County’s economic performance at the end of 2014 leaves continued-optimism for 2015 as the rational expectation.

Rich County Economic Update

Rich County Ends 2014 with Solid Economic Performance

By Matt Schroeder


Rich County ended 2014 with stable job expansion and encouraging signs for 2015. Wages, which have been slow to keep up with the rest of the recovering labor market, finally turned a corner. Taxable sales were up more than 30 percent with particular strength in retail markets suggesting that consumer confidence continues to build. Motor vehicle sales were particularly strong thanks in part to falling oil prices. Unemployment continues to fall and initial unemployment insurance claims are back to pre-recession levels. Employment growth was not particularly impressive, but it was consistent. Overall, the roots of recovery appear to be firmly set in the region and Rich County’s economic performance at the end of 2014 leaves continued-optimism for 2015 as the rational expectation.

Thursday, November 20, 2014

Rich County Economic Indicators

The Bear River region felt the effects of the downturn starting in 2009, when the labor market shed 3,795 jobs from the previous year. For the next two years, the region lost jobs (though Cache County contracted in 2009 only). The tide turned in 2012 when annual job gains in Cache and Rich counties outweighed job losses in Box Elder County. And while regional momentum continued to build in 2013, Bear River’s year-over growth measured consistently slower than the state average. So far, 2014 appears to be a different story with regional employment outpacing the rest of the state through the first six months of the year.
  • Rich County saw payroll employment grow at the slowest year-over rate of the three counties in the Bear River region. From second quarter 2013 to second quarter 2014 the county added 15 jobs, a growth rate of 2.2 percent. Retail trade shrank 20.1 percent and shed the most jobs (13) of any industry.
  • Although job growth in the county came in below the Utah average, the unemployment rate continues to fall. The rate settled at 2.3 percent in September, which is among the lowest figures in the state. Like Cache County, the slack in the labor market is dissipating dramatically in 2014.  
  • The tightening of the labor market might be reflected in the county’s quarterly increase in average monthly wages, which increased 2.6 percent from 2013. It is also likely that this quarterly increase is in part a reflection of losing several jobs in a low-paying industry like retail sales.
  • Second quarter 2014 taxable sales in Rich County were down significantly from 2013, but the data are skewed by the inclusion of adjustment for prior periods (similar to Box Elder County). If these adjustments are excluded, the county actually experienced a healthy 6.8 percent increase in taxable sales over the year.
  • Two fewer homes were sold in third quarter 2014 (17) compared to the year prior (19), and year-to-date data point to a consistent downward trend in 2014 home sales (down 42.6 percent).

Cache County Economic Indicators

The Bear River region felt the effects of the downturn starting in 2009, when the labor market shed 3,795 jobs from the previous year. For the next two years, the region lost jobs (though Cache County contracted in 2009 only). The tide turned in 2012 when annual job gains in Cache and Rich counties outweighed job losses in Box Elder County. And while regional momentum continued to build in 2013, Bear River’s year-over growth measured consistently slower than the state average. So far, 2014 appears to be a different story with regional employment outpacing the rest of the state through the first six months of the year.
  • Year-over payroll employment in Cache County grew 3.3 percent in second quarter 2014. The rate of growth was the same for both the goods-producing and the service-providing sectors. Financial activities, leisure/hospitality, professional/business services, and construction all grew faster than 5 percent compared to the previous year, adding a combined 928 jobs over the year.
  • Cache County boasted one of the lowest seasonally-adjusted unemployment rates in the state at 2.7 percent in September. The unemployment rate in the county has measured below 3 percent since March. Such low levels of unemployment are not unheard of in Cache County, but the relatively low rate suggests that the county’s job market is getting considerably more competitive.
  • Average monthly wages in second quarter increased 1.7 percent from 2013. And while Cache County’s wage growth was perfectly aligned with the Utah average, the average monthly wages paid in the county totaled $795 less than Utah’s $3,396 per month.
  • Cache County’s year-over changes in taxable sales increased for the ninth consecutive quarter. Second quarter 2014 taxable sales in the county totaled just over $370 million, an increase of 2.9 percent from second quarter 2013. Manufacturing business investment figures – the sixth largest industry by sales totals – posted the most notable gain of 16.1 percent.
  • In Cache County, 336 homes sold in third-quarter 2014, a decline of 12.5 percent from the previous year. The year-to-date total from 2013 to 2014 indicates that that decline is slightly exaggerated by quarterly volatility, but growth in the housing market seems to be slowing from last year’s pace.

Box Elder County Economic Indicators

The Bear River region felt the effects of the downturn starting in 2009, when the labor market shed 3,795 jobs from the previous year. For the next two years, the region lost jobs (though Cache County contracted in 2009 only). The tide turned in 2012 when annual job gains in Cache and Rich counties outweighed job losses in Box Elder County. And while regional momentum continued to build in 2013, Bear River’s year-over growth measured consistently slower than the state average. So far, 2014 appears to be a different story with regional employment outpacing the rest of the state through the first six months of the year.
  • Box Elder payroll job growth in second quarter 2014 accelerated to an annual rate of 4.0 percent, the seventh fastest year-over job growth in the state and 1.2 percentage points faster than the Utah average. In total, the region added 670 jobs from second quarter 2013. Construction and manufacturing firms had notable gains of nearly 13 percent and 6 percent, respectively. Manufacturing industry growth is a particularly positive indicator of improving economic health.
  • The county’s seasonally-adjusted unemployment rate fell to 3.9 percent in September. The last time Box Elder County had an unemployment rate under 4.0 percent was August of 2008. Despite the positive trend, the unemployment rate still registers 0.4 percentage points higher than the state average of 3.5 percent.
  • Although the labor market in the county picked up steam in second quarter 2014, average wages in the county continued to sputter along. Year-over wage growth equated to 0.9 percent, nearly 1 percentage point slower than the Utah rate of 1.7 percent. As the labor market gets tighter, there should be upward pressure on employee compensation, but it could be some time before consistently higher wages materialize. 
  • Box Elder experienced a 15 percent decline in taxable sales from second quarter 2013 to second quarter 2014. The majority of the decline in taxable sales for the county came from adjustments for prior periods, which does not reflect normal business transactions. Excluding these adjustments from second quarter taxable sales results in a 5.9 percent increase from 2013 to 2014 (consistent with the recent growth rates).
  • Year-over home sales dipped 7.7 percent in third quarter of this year according to the Utah Association of Realtors. Though the housing market has come a long way since 2009, sales across the state were flat in between the third quarters of 2013 and 2014.

Monday, July 21, 2014

Bear River Location Quotients

Tyson Smith, Regional Economist

In the summer issue of Local Insights we discussed the value of economic diversity and the Hachman Index (a method used to measure industry diversification in the labor market)[1]. The article states that:

The Hachman Index is derived from the weighted average of the industry Location Quotients (LQ) in a region. A LQ measures the regional concentration of employment in a given industry relative to a larger geography. As a rule of thumb, an LQ of 1.2 or higher represents an industry with a relatively high concentration of regional employment, while a score of 0.8 or lower indicates sparse regional employment… Breaking the Hachman Index into individual components provides insight into the distribution of employment in a local economy.

Figure 2 in that article resembles the charts to the right, except that the data in the article was aggregated to the regional level. Combining the employment counts for all three Bear River counties obscures the concentration of employment in certain industries at the county level. This article sheds light on the relative density of employment in each county.

When examining the three charts, note the scale on the horizontal axis. In 2012, Cache County had very few location quotient outliers. Four industries were within the “normal” location quotient range, and only two industries had LQs greater than 1.2. Furthermore, the industries with above normal concentration of employment in Cache (manufacturing and educational services) registered LQs substantially lower than the highly concentrated industries in Box Elder and Rich counties.

Box Elder County had five industries in the “normal” LQ range, but three of the four high-density industries recorded LQs above 2. This means that the proportion of the workforce employed in manufacturing, transportation & warehousing and agriculture, forestry, fishing & hunting more than doubled the national percentage.

Lastly, Rich County had the lowest Hachman Index among the Bear River counties. Among the 10 industries that meet disclosure standards, only two industries had employment LQs in the “normal” range.

In Utah, there is a correlation between the size of a county’s labor force and the degree of industrial diversity in the county; in general, this means the more workers in a county the more diverse the economy of that county.  So it is not surprising that Cache County has less variance in its respective LQs compared to Box Elder and Rich counties.

Understanding the relative concentration of employment by industry lends some insight into the comparative advantages of a region. In terms of Bear River, we see that the labor economy is moderately diverse compared to other counties in the state.


[1] Article titled: Economic Diversity in Bear River